
Shrimp, Fish, Whale - Who Actually Holds the Coins

No other market describes its participants like this one: shrimp, crabs, fish, sharks, whales. You wear your weight class as a nickname, and most people wear it with humor - “shrimp” isn’t an insult in this space, it’s a grid reference.
What interests me about the taxonomy is something else: it’s the key to the question of who actually owns Bitcoin. And it shows why almost every headline about “concentration” takes a wrong turn at the same spot. This is an attempt to untangle the distribution honestly - with numbers that are sourced and dated, and with the limits right next to them.

Illustrative image, AI-generated.


The taxonomy
Today’s common classification comes from the analytics firm Glassnode, which sorts Bitcoin holders into eight sea-creature classes by balance:
- Shrimp < 1 BTC
- Crab 1 – 10 BTC
- Octopus 10 – 50 BTC
- Fish 50 – 100 BTC
- Dolphin 100 – 500 BTC
- Shark 500 – 1,000 BTC
- Whale 1,000 – 5,000 BTC
- Humpback > 5,000 BTC
Two things before this table does damage. First: there is no official whale definition - the animal names are research vocabulary; the most common convention is “whale = at least 1,000 BTC.” Second, and this is the most important sentence in this post: these classes count entities - actors estimated via cluster analysis - not addresses. The difference sounds technical and changes everything; more on that in a moment.
Where does the sea-creature metaphor come from? The common story points to casino jargon, where “whales” are the players with the really big stakes. That origin isn’t rigorously documented anywhere. What’s certain: by 2014 at the latest, the image was firmly established - when an anonymous holder placed a sell order of roughly 30,000 BTC far below market price on Bitstamp, the scene christened him “BearWhale” within hours, the market absorbed the order, and the “Slaying of the BearWhale” became community folklore, fan art included.

The whale hoodie from the Crypto Collection - the humpback as an embroidered motif, the anchor of the line. Illustrative image, AI-generated.
An address is not a person
Now for the part where most statistics fail.
As of July 23, 2026, counted by addresses (BitInfoCharts, live): about 98.6% of all Bitcoin addresses hold less than 1 BTC - together, though, only about 7.3% of the coins. At the other end, 2,040 addresses with at least 1,000 BTC each hold around 36% of the circulating supply. That’s roughly 0.003% of all addresses.
If you turn that into “0.003% own a third of Bitcoin,” you’ve already made the crucial mistake. The most famous case: in late 2020, the figure “2% of accounts control 95% of all Bitcoin” ran through the world press - what was counted were addresses. But a Bitcoin address is not an account, let alone a person, and that cuts both ways:
One address, millions of people
The largest Bitcoin address in existence is a Binance cold wallet - roughly 248,600 BTC, identified by the exchange itself as its own custody address (as of 23 Jul 2026; attribution from its 2022 proof-of-reserves post). By address statistics, that’s a single mega-humpback. In reality it holds customer funds of an exchange that claims over 300 million registered accounts. The “whale” is a parking garage.
One actor, thousands of addresses
The ~1.1 million BTC presumably attributable to Satoshi Nakamoto sit spread across some 22,000 addresses of 50 BTC each - a single early miner who looks like thousands of well-behaved middle-class holders in address statistics. (That’s a well-founded estimate based on the “Patoshi” pattern discovered by Sergio Demián Lerner, not a proven fact - the coins haven’t moved since 2009/2010.)
Glassnode’s entity counting tries to correct exactly this: addresses recognizably controlled by the same actor get merged into clusters - using heuristics that trace back to academic work on blockchain analysis. Important for honesty’s sake: this too is a statistical estimate with proprietary rules, not a measurement. But it’s the much better approximation.
And entity-adjusted, the picture flips: instead of “2% control 95%,” Glassnode’s counter-calculation in early 2021 put it at about 71.5% for the top 2% of entities - of which, in turn, a substantial part are exchanges and custodians holding coins for millions of people. In the last fully public breakdown (2022/23), shrimp held about 6.6% of supply entity-adjusted, crabs about 10.5%, whales from 1,000 BTC (excluding exchanges) about 34%. More recent entity figures sit behind paywalls - I’d rather write “as of 2022/23” than pretend they’re from today.
Who actually holds the big stacks
The most interesting development of recent years: the biggest whales now have names. As of July 2026, every figure dated with its source:
- Satoshi Nakamoto: ~1.1 million BTC (estimate, see above) - unmoved for over sixteen years. Measured against the 21-million cap, that’s a good 5%.
- US spot ETFs combined: ~1.22 million BTC (aggregation of official fund disclosures, 21 Jul 2026), of which BlackRock’s IBIT alone holds ~737,000 BTC (17 Jul 2026). For perspective: these ETFs have only existed since January 2024.
- Strategy (formerly MicroStrategy): 843,775 BTC (treasury tracker, 6 Jul 2026) - the largest corporate position in the world. The plot twist of the summer: in early July 2026, of all whales, the “never sell” whale sold at scale for the first time - 3,588 BTC, to fund dividends.
- US government: ~325,000 BTC by on-chain attribution (Arkham, 15 Jul 2026) - mostly seized coins, formally held in a “Strategic Bitcoin Reserve” with a no-sale order since March 2025. Parts are still in litigation, and the attribution is cluster analysis, not a state balance sheet.
- China: ~194,000 BTC from the 2019 PlusToken seizure - if they’re still there. Whether China holds or sold long ago is openly disputed; there are prominent voices for both. Germany, by the way, sold its roughly 50,000 seized BTC completely in 2024.
- Exchanges combined: roughly 2.4 million BTC (order of magnitude; April 2026) - almost entirely customer funds. The exchange is a custodian, not a whale.
- Lost: the most-cited estimate (Chainalysis, 2017) put it at 2.8–3.8 million BTC - while counting Satoshi’s coins as lost. Newer analyses land around ~3 million on average. “Lost” is always interpretation: what’s observable is only “unmoved for a long time,” and there are enough cases of ten-year sleepers suddenly waking up.
Counting by holder type instead of size, the best public overall estimate (River Research, August 2025) puts roughly two thirds of the supply in the hands of individuals. The rest is spread across funds, companies, governments - and the lost.
One more honesty footnote on the percentages: some figures refer to circulating supply (~20.1 million BTC as of July 2026), some to the 21-million cap. I’ve stated the basis for each - skip that, and you can be off by a few percentage points without technically lying.
What the bear market does to the classes
The reason this taxonomy is more than folklore: it makes visible who buys in which market phase - and the data has been telling the same remarkable story for years.
In the 2022 bear market, shrimp absorbed 105% of new issuance according to Glassnode - meaning they took in more coins than were even newly mined. Crabs came in at 119%. Right after the FTX collapse in November 2022, inflows to the two smallest classes hit record levels. In the crash, the small ones bought; whales, miners and exchanges lost supply share over the same period.
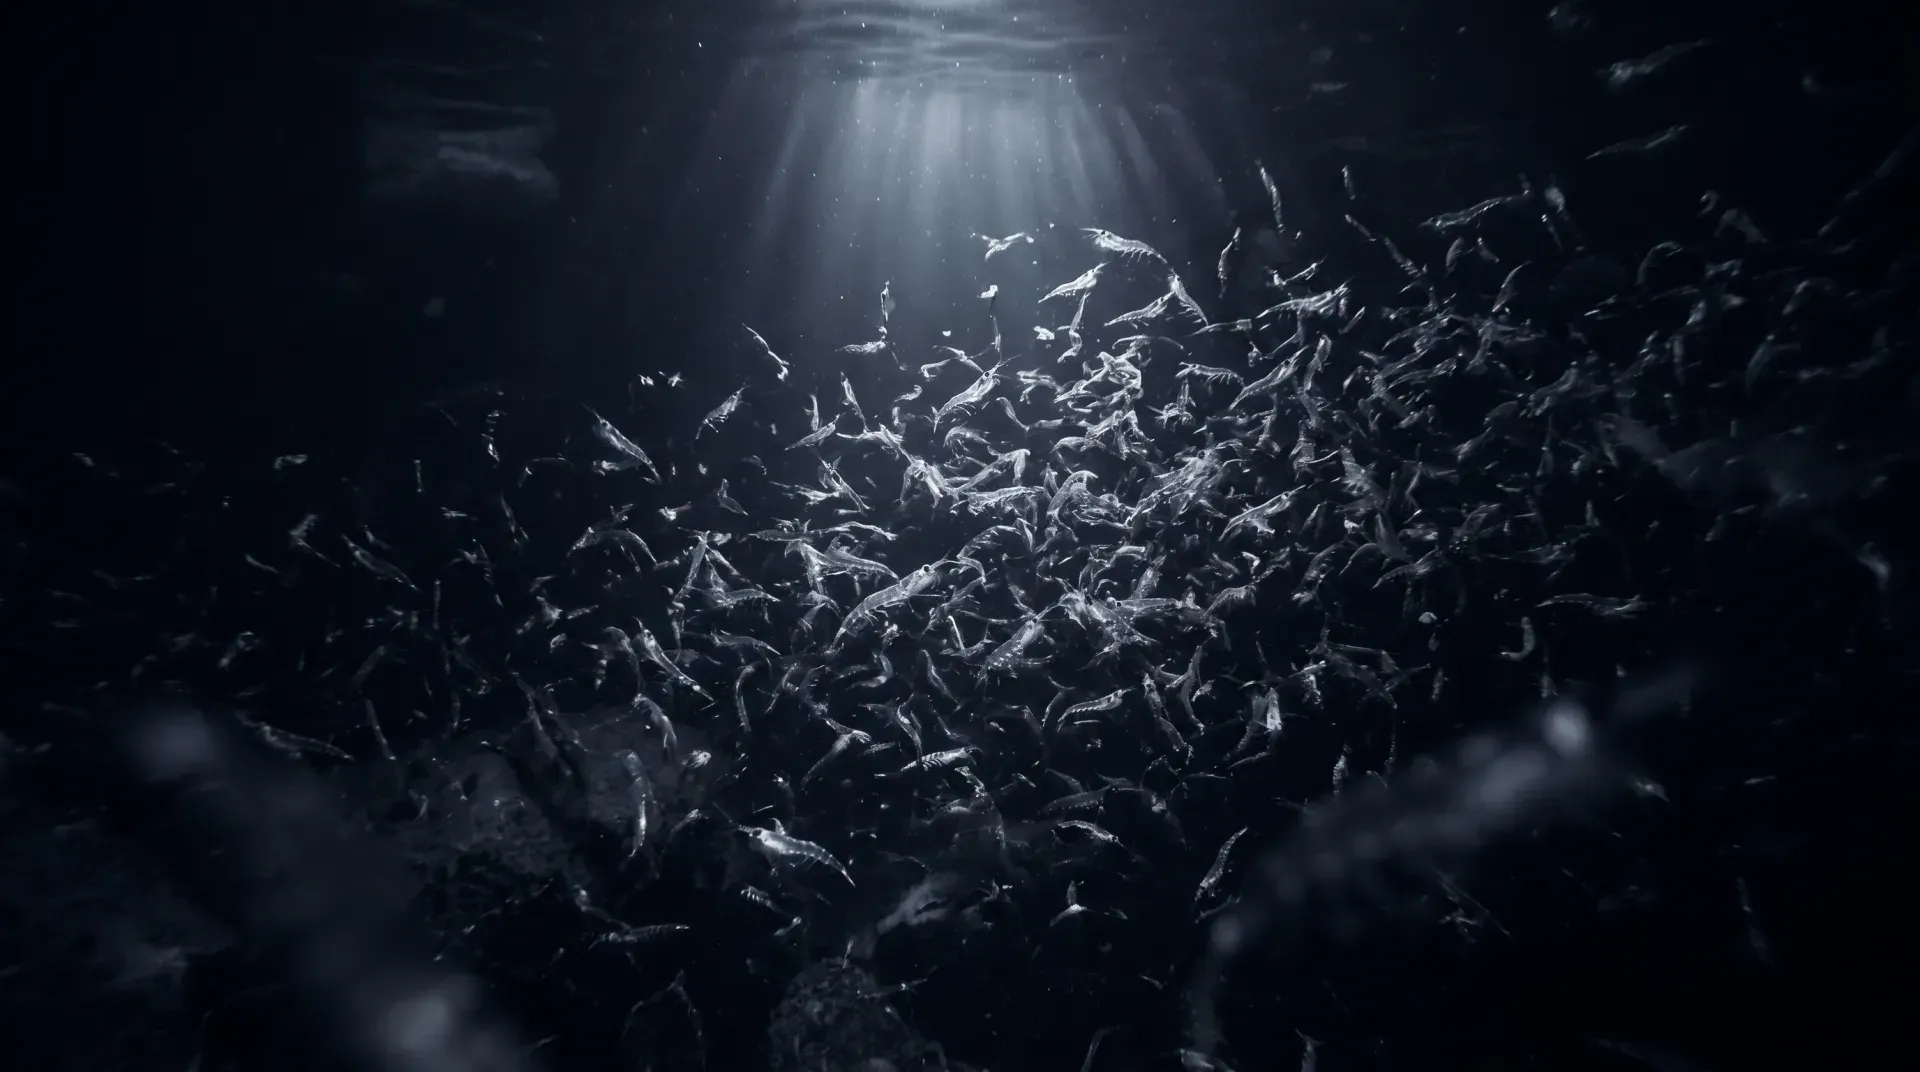
Illustrative image, AI-generated.
And the current drawdown - price at times more than halved from the October 2025 high - has so far repeated the pattern strikingly closely: in January 2026, the 10-to-1,000-BTC cohort accumulated around 110,000 BTC within thirty days, the fastest pace since the FTX collapse (CoinDesk/Glassnode, 18 Jan 2026). In early July 2026, accumulation scores showed the smallest classes near maximum - and the biggest whales close to neutral (CoinDesk/Glassnode, 2 Jul 2026).
I’m writing this as description, not as a signal. That shrimp have historically accumulated in fear phases says nothing about whether that’s smart this time - in 2022 it looked very wrong for months before it looked very right. The data shows behavior, not the future.
What the classes don’t show
Before you take the taxonomy too seriously - four blind spots worth knowing:
- Custody hides ownership. The ~2.3 million BTC on exchanges already stood for an estimated ~130 million customer accounts in 2023. On-chain: a handful of humpbacks. Economically: millions of shrimp. The same goes for the ETFs - around 80% of their holdings sit with a single custodian (Coinbase Custody), held for millions of brokerage accounts.
- Paper claims are not coins. The most brutal illustration remains FTX: when the restructuring team took over in November 2022, they found 105 BTC on-chain - against customer claims of nearly 100,000 BTC. A balance on a platform is a claim against a company, not a holding in any class.
- The opposite direction isn’t quite right either. If you conclude from all this that concentration is just a measurement artifact, you’re overshooting the other way: the most thorough academic analysis (NBER, Makarov/Schoar 2021) found, even after clustering and removing intermediaries, around 5 million BTC held by the top 10,000 individual holders - about 27% of the supply at the time. Bitcoin is far more widely distributed than the address headlines claim, and considerably more concentrated than its defenders would like. Both at once.
The arithmetic at the end
One calculation needs no study, just division: 21 million BTC divided by a good eight billion people is about 0.0026 BTC per head. Even under perfect equal distribution - which will never exist - at most around 0.26% of humanity could ever hold a whole bitcoin. In reality it’s far fewer: as of 23 Jul 2026 there are about 979,000 addresses with at least 1 BTC - even if every one of them were a separate person (they’re not, see above), that would be under 0.02% of the world’s population.
The rule of thumb floating around the space - that 0.28 BTC puts you arithmetically in the top one percent - traces back to a napkin calculation by Steve Lee (2018) and went viral in 2020. It ignores lost coins, institutions and the actual distribution. Fine as a bon mot, not as a number with decimal places.
Maybe that’s what makes the sea-creature language so durable: it’s more honest than most statistics about it. It admits there are weight classes. It makes no promises about climbing into one. And it has the humor to name the lowest tier after an animal that has quietly kept stacking through every fear phase of recent years.

The shrimp hoodie from the Crypto Collection - the smallest class, named after the animal that never stops stacking. Illustrative image, AI-generated.
If you wear your weight class with humor anyway: the Crypto Collection in the shop spells out exactly this hierarchy in fabric - from the shrimp hoodie to the tiers tee.
Sources and limits
The address figures (BitInfoCharts) and explorer data were pulled live on July 23, 2026 and start aging immediately; I’ll refresh them before this post is published. The entity breakdown is honestly dated 2021 and 2022/23 - newer data sits behind Glassnode’s paywall, and I’d rather cite old open data than fresh unverifiable data. Holdings of ETFs, Strategy and governments come from fund disclosures, treasury trackers and Arkham attributions (dated in the text); on-chain attributions to governments are estimates, not balance sheets. Self-reported figures (Binance user counts) are marked as such. I deliberately left out several circulating numbers about “whale buying” in June 2026 that traced back only to press-release portals.
Questions, or spotted a mistake? Write to me.
Comments
Sign in to comment, like and save. Sign in →
No comments yet. Write the first one.